Research Article | | Peer-Reviewed

A Comprehensive Assessment of Post-COVID-19 Changes and Its Correction with the Help of G. Lucidum and Alkhaday

Received: 30 December 2025     Accepted: 8 January 2026     Published: 10 March 2026
Views:       Downloads:
Abstract

In December 2019, a series of acute respiratory illnesses characterized by rapid worsening of symptoms, pneumonia, acute respiratory distress syndrome (ARDS), and in some cases, death were observed in Wuhan City, Hubei Province, China. To achieve the set objective, the results of treatment of 100 sexually mature rats of both sexes with coronavirus infection caused by COVID -19 were analyzed. All animals were divided into groups: Group 1 - animals with coronavirus infection with a confirmed positive PCR test, treated with ivermectin at a dosage of 300 mg of body weight (n = 25), Group 2 - animals with coronavirus infection treated with baicalin at a dosage of 500 mg (n = 25), Group 3 - animals with coronavirus infection treated with molnupiravir 25 mg / kg of body weight (n = 25), Group 4 - animals with coronavirus infection treated with a new drug based on G. lucidum and black cumin (n = 25). Lymphocytic myocarditis was detected in all rats (100%). Dystrophic changes in cardiomyocytes were also detected in 57.4% of cases, apoptotic bodies in 29.41% of cases, uneven cardiomyocyte hypertrophy in 85.29% of cases, and lipofuscinosis in 45.59% of cases. Subendocardial lipomatosis in the cardiac conduction system was observed in 51.47% of cases. The average percentage of lipomatosis area from the micrograph area was 2.47±3.12%. The area under the curve (AUC) = 0.91 (95% CI = 0.85-0.98). The prediction accuracy of the prognostic model was 91.7%, sensitivity was 0.87%, and specificity was 0.95%. AUC was 0.91 (95% CI = 0.85-0.98), p < 0.001.

Published in American Journal of Medical Science and Technology (Volume 2, Issue 2)
DOI 10.11648/j.ajmst.20260202.13
Page(s) 32-56
Creative Commons

This is an Open Access article, distributed under the terms of the Creative Commons Attribution 4.0 International License (http://creativecommons.org/licenses/by/4.0/), which permits unrestricted use, distribution and reproduction in any medium or format, provided the original work is properly cited.

Copyright

Copyright © The Author(s), 2026. Published by Science Publishing Group

Keywords

Acute Respiratory Distress Syndrome, SARS - CoV -2, Ganoderma Lucidum, Alkhadaya

1. Introduction
In December 2019, a series of acute respiratory illnesses characterized by rapid worsening of symptoms, pneumonia, acute respiratory distress syndrome (ARDS), and in some cases, death were observed in Wuhan City, Hubei Province, China .
According to the classification, the SARS-CoV-2 virus belongs to the kingdom Riboviria, order Nidovirales, suborder Cornidovirineae, family Coronaviridae, subfamily Orthocoronavirinae, genus Betacoronavirus, subgenus Sarbecovirus and the SARS- coronavirus species.
According to Natalie M. Kirk (2024) et al. link the pathogenesis of coronavirus infection to the fact that coronaviruses attach to host cells through interactions between the S protein and various cellular receptors, which determines the species and tissue specificity of the virus. The receptor binding domain (RBD) of the S1 subunit of protein S binds to the host cell, leading to conformational changes and fusion with the cell membrane mediated by the S2 subunit of protein S . ACE2 (angiotensin-converting enzyme 2) receptors are found on epithelial cells of the respiratory and gastrointestinal tracts, as well as on the endothelium, heart, kidneys, thyroid gland, liver, and brain. In contrast, MERS- CoV binds to dipeptidyl peptidase, a cell surface enzyme with a wide tissue distribution. Other coronaviruses bind to aminopeptidase N (HCoV-229E) or sialic acid residues (HCoV-OC43 and bovine coronavirus) .
Data Xi Li (2024) the receptor binding domain (RBD) of the S1 protein binds to receptors on the surface of host cells, allowing viral particles to attach to the cells, while the S2 protein promotes membrane fusion and entry of RNA genes. Although the RBD of SARS- CoV and SARS-CoV-2 share 72% similarity in amino acid sequences, computational modeling and biophysical measurements showed that the RBD of SARS-CoV-2 binds to ACE2 with higher affinity than the RBD of SARS- CoV. This may be due to the substitution of valine 404 in the SARS- CoV RBD is mutated to lysine 417 (a polar amino acid) in the SARS-CoV-2 RBD, resulting in stronger binding to ACE2. SARS-CoV-2 is known to enter host cells through two pathways, namely the endocytic pathway and the transmembrane serine protease 2 (TMPRSS2) -mediated cell surface entry . When SARS-CoV-2 binds to ACE2 through the RBD of the S protein, the structure of the S protein is altered, allowing TMPRSS2 and cathepsins on the cell surface to cleave the S protein. Subsequently, proteolytic processing at the S1/S2 interface and at the S2 cleavage site removes the covalent bond of the two functional subunits, leading to dissociation of S1 and facilitating exposure of the S2 subunit domain, which initiates the fusion reaction by inserting the hydrophobic fusion peptide into the cell membrane. Subsequently, TMPRSS2 cleaves the S1/S2 region, causing viral fusion with the membrane via the S2 domain (although other proteases, such as endosomal Cysteine proteases, cathepsin B and L, furin, basin, and neuropilin-1, also play a role, but TMPRSS2 has been shown to be essential for SARS-CoV-2 pathogenesis) .
According to Jonathan According to N. Carvajal et al. (2024) , the SARS-CoV-2 virus has a positive-sense single-stranded RNA genome (ssRNA +) with an approximate length of 29,891 nucleotides (~30 kb) containing 15 open reading frames (ORFs). In the lungs, the virus enters the cell through the spike protein (S protein), which consists of two subunits (S1 and S2). The initial step of infection involves the binding of S1 to the host RBD. After membrane fusion, the SARS-CoV-2 viral nucleocapsid is removed, and the viral genome is released into the host cell cytoplasm. Viral infection generates pathogen-associated molecular patterns (PAMPs) and damage-associated molecular patterns (DAMPs), which are recognized by various pattern recognition receptors (PRRs) . Activation of these PRRs leads to the activation of downstream transcription factors such as interferon regulatory factor (IRF) 3 and activated nuclear factor-kappa light chains of B cells (NF- kB), which express type I and III interferons (IFNs), as well as proinflammatory agents, cytokines, tumor necrosis factor α (TNF-α), transforming growth factor β (TGF-β), interleukin (IL)-1β, IL-6, IL-8, IL-12, IL-18, and chemokines such as ligands chemokines (CCL) CCL2, CCL3, CCL5 and ligand motifs chemokines CXC (CXCL) 8, CXCL9 and CXCL10 .
According to a review provided by Jingshu Zhang et al. (2024) observed AT2 cell hyperplasia in the lungs of patients who died from both SARS- CoV and SARS-CoV-2 infection. In the lungs of COVID-19 patients, sequencing scRNA showed that both AT1 and AT2 cells express lower levels of cell type identity markers but increased expression of genes involved in apoptosis. Furthermore, AT2 cells lose the ability to differentiate into AT1 cells, demonstrating an inflammation-associated transient progenitor state that impairs lung regeneration . This is consistent with the observations of Chen et al. in SARS- CoV fatal cases, where virus-positive lung cells belonged to a novel subset demonstrating a stem/ progenitor state, lacking AT1 and AT2 markers. Furthermore, in lung autopsies following SARS- CoV infection, virus-infected ACE2+ cells produced higher levels of proinflammatory cytokines. Further studies are needed to determine whether this unique subpopulation of SARS- CoV -positive lung cells was subjected to a similar inflammatory state as during SARS-CoV-2 infection and whether this contributed to disease progression during SARS- CoV infection .
Currently, there are a number of medications used to treat coronavirus infection. These include ivermectin, baicalin, molnupiravir, and remdesivir . However, they have a negative effect on the liver, leading to chronic damage to this organ. In this regard, it would be worth considering natural antioxidants such as Ganoderma. Lucidum and black cumin oil (Alkhadaya) . They have a fairly pronounced antiviral effect, but their use has not yet been sufficiently studied, since these natural antioxidants are classified as biologically active substances, not drugs, which calls into question the reliability of these preparations. However, I am developing a preparation based on Ganoderma Lucidum and Alkhadaya, and there are already successful experimental data that have been published in leading scientific journals, including the Scopus list . At the same time, the use of this drug requires care in determining the dosage and route of administration, since incorrect interpretation of my research can lead to the drug's ineffectiveness. Therefore, I want this study to acquire a comprehensive study and it should cover the largest possible number of methods, which included histological, biochemical, immunohistochemical, determination of chitotriosidase, C-reactive protein, D - dimer, as well as an electroneuromyographic study, a study of the ELIN test.
The aim of the study was to conduct a comprehensive, randomized, double-blind study of the effects of a new combination drug based on Ganoderma. Lucidum and Alkhadaya on the course and prognosis of coronavirus infection caused by SARS - CoV -2.
2. Materials and Methods of the Study
To achieve the set objective, the results of treatment of 100 sexually mature rats of both sexes with coronavirus infection caused by COVID -19 were analyzed. All animals were divided into groups: Group 1 - animals with coronavirus infection with a confirmed positive PCR test, treated with ivermectin at a dosage of 300 mg of body weight (n = 25), Group 2 - animals with coronavirus infection treated with baicalin at a dosage of 500 mg (n = 25), Group 3 - animals with coronavirus infection treated with molnupiravir 25 mg / kg of body weight (n = 25), Group 4 - animals with coronavirus infection treated with a new drug based on G. lucidum and black cumin (n = 25).
Rats were intranasally infected with the SARS - Cov -2 strain at 50% of the tissue culture median infectious dose (TCID 50) per 50 μl of inoculum (live culture biopreparation) after intraperitoneal anesthesia using 2.5% sodium thiopental solution.
2.1. The Morphological Research Method
This is included standard methods: fixation, staining of sections with hematoxylin and eosin, and examination of sections under a microscope.
2.2. The Immunohistochemical Method
This is involved antibodies (IgG and IgM) being swept with enzymes or fluorescent dyes, which bound to coronavirus antigens and stained them for further microscopic examination. An indirect method was used, which included secondary antibodies to enhance the signal. Tissue- and cytospecific antibodies were used. The study was conducted on an automated immunohistostainer. Leica Bond max (Germany). The following antibodies were used in the study: CD3 (manufacturer Cell Marque, titer 1:1000); CD20 (manufacturer Cell Marque, titer 1:500); CD45 (manufacturer Dako, titer 1:100); CD68 (manufacturer Dako, titer 1:50); Perforin (manufacturer Cell Marque, 1:50); TLR-4 (manufacturer Gene Tex, titer 1:200); TLR-9 (manufacturer Gene Tex, title 1:50); SARS-CoV-2 nucleocapsid antibody (manufacturer Gene Tex, titer 1:500); SARS - CoV -2 spike antibody (manufacturer Gene Tex, titer 1:500). Positive and negative control reactions were performed. Expression of CD3 and CD45 was assessed quantitative (number of stained inflammatory infiltrate cells per 1 mm2) and semi-quantitative (in points) methods. Expression of CD20, CD68, and perforin was assessed as a percentage of stained infiltrate cells to the total number of infiltrate cells. Expression of TLR-4 and TLR-9 was analyzed quantitatively (percentage of cells with positive expression) and semi-quantitative (in points) methods.
To visualize positive cells, the Envision polymer system (Dako, Denmark) and diaminobenzidine (DAB, brown staining) (Dako, Denmark) were used as a chromogen. In the case of a positive reaction, the antigen turned brown. The number of color-labeled (positive) cells was determined at 200x magnification of a light microscope in three fields of view (720 × 530 μm in size), selected taking into account the degree of staining intensity (i.e., the largest cluster of labeled cells), using the UTHSCSA ImageTool 3.0 image analysis software (USA).
2.3. ELIN Test Research
The ELIN test distinguishes between: IgG to NF 200, which is a marker of changes in axons, IgG to glial fibrillary acidic protein, which is a marker of changes in astrocytic glia, IgG to S 100 B, which is a marker of tissue growth and differentiation, IgG to total myelin protein, which is a marker of changes in the myelin sheaths of nerve fibers, IgG to voltage-dependent calcium channels, which is a marker of changes in neuromuscular contacts, IgG to H-cholinergic receptors, which is a marker of changes in the H- acetylcholine receptor system, IgG to glutamate receptors, which is a marker of changes in the glutamate receptor system, IgG to GABA receptors, which is a marker of changes in the GABA receptor system, IgG to dopamine receptors, which is a marker of changes in the dopamine receptor system, IgG to serotonin receptors, IgG to opiate receptors, IgG to beta- endorphin.
Accordingly, blood obtained from the caudate vein of rats was evaluated by multiparametric Screening ELISA is a test system for analyzing early changes in the nervous system during coronavirus infection.
2.4. Chitotriosidase Determination
For this purpose, a drop of venous blood was applied to a standard filter card (Greenvan-Biocard) and dried at room temperature. Then, the samples were transported to the laboratory of Tashkent State Medical University, where chitotriosidase activity was determined by a fluorimetric method using the synthetic substrate 4-methylumbellifer yl-tri-N-acetyl-β- chitotriosidase. Samples of dried spots were stored in a regular refrigerator at +4°C until shipment. The shelf life before shipment of materials did not exceed 7 days. Next, in the laboratory, the sample was extracted from a spot 3.2 mm in diameter with 0.25 M sodium acetate (pH 5.5) for 60 minutes on an ST-3L shaker-incubator (Elmi, Latvia) at 370°C, 900 rpm. To 10 μl of the extract were added 50 μl of 0.02 mM 4-methylumbelliferyl-tri-N-acetyl-β- chitotrioside in 0.1/0.2 M citrate-phosphate buffer pH 5.2. The enzyme reaction was carried out in an ST-3L shaker-incubator (Elmi, Latvia) for 30 minutes at 37°C, 500 rpm. The reaction was stopped with 250 μl of 0.4 M glycine-carbonate buffer pH 10.3. Fluorescence intensity was determined using a PE EnSpire reader (Perkin Elmer, USA). Chitotriosidase activity was calculated as nM 4-methylumbelliferin released from 4-methylumbelliferyl-tri-N-acetyl-β- chitotriosidase during the enzymatic reaction per milliliter per hour. The concentration of 4-methylumbelliferin was obtained by constructing a calibration curve.
A complete blood count was also performed (number of leukocytes, lymphocytes, neutrophils, absolute neutrophil to lymphocyte ratio, hemoglobin, platelet count, erythrocyte sedimentation rate, C-reactive protein, alanine aminotransferase, aspartate aminotransferase, creatinine, total protein, D- dimer, activated partial thromboplastin time, prothrombin index, international normalized ratio.
2.5. Electroneuromyographic Study
This was performed on the Synapsis device (Neurotech, Russia). The set of complementary ENMG methods used in the examination of experimental animals included the registration and analysis of M-responses. The shape of the stimulating impulses was rectangular, the duration was 1 ms, the intensity was supramaximal; the type of stimulating electrode was fork-shaped (S403); the points of nerve stimulation during the registration of M-responses of the foot muscles were distal; the method of recording was unipolar (bellytendon); the analyzed parameter was the amplitude from peak to peak. Maximum H-reflexes of m. gastrocnemius were recorded (the shape and duration of stimulating stimuli, the method of recording and the analyzed parameters were the same as for M-responses). Global electromyograms were analyzed: the functional test was “maximum voluntary tension”; test objects were m. Biceps femoris, m. gastrocnemius (cl.), m. peroneus longus, m. tibialis cranialis; lead type: bipolar; electrode diameter: 3 mm, interelectrode distance: 5 mm; analyzed parameters: average amplitude (AA) and signal repetition rate.
Electrodes were implanted in the biceps femoris muscle of rats, and electrical activity (action potential) was recorded, along with motor activity during wakefulness. Electrode implantation was performed under anesthesia with a low dose of sodium thiopental (25 mg / kg), administered during wakefulness. This dose allows the animals to awaken 30-35 minutes after injection. The injection was performed into the rat's caudate vein, followed by insertion of stainless steel needles at specific points, followed by electrical stimulation in the form of biphasic rectangular pulses of 150 ms duration and 1 mA intensity.
Operation protocol:
1) Anesthetize the injection site with 25 mg/kg sodium thiopental. Confirm the depth of anesthesia and observe for no reaction after pinching the paws. Shave the fur and sterilize the skin with povidone -iodine and 70% ethyl alcohol.
2) We sterilize the scalpel and hemostatic scissors using 70% ethyl alcohol.
3) Using a scalpel, we make an incision along the biceps femoris muscle, moving in a caudal direction.
4) We separate the skin and muscles and insert 2 electrodes into the biceps femoris muscle.
5) We use gauze to stop the bleeding.
6) We insert electrodes into the muscle and conduct an ENMG study.
Statistical processing of the obtained data. For statistical processing of the data, we used the Python programming language v.3.8.12 (Anaconda distribution) and its modules for analysis, in particular: Sklearn, Pandas, Nona, Numpy, Sweetviz, Seaborn for data and Matplotlib and Plotly for visualization. Statistica and SPSS programs were also used. The database was created in Microsoft Excel 2019. The Mann-Whitney U test was used to compare quantitative parameters in independent patient groups, and the Wilcoxon signed-rank test was used to compare related samples. Percentage comparisons in multi-field contingency tables were performed using the Pearson chi-square test. Since the outcome was initially unknown, survival was estimated using the Kaplan-Meier estimator. Using ROC analysis and AUC, the most accurate threshold values for these parameters were determined. The odds ratios for achieving the selected endpoints were then calculated.
3. Results
Figure 1. Changes in the myocardium of rats under the influence of coronavirus infection.
Hematoxylin and eosin staining, a - lymphocytic myocarditis, b - subendocardial lipomatosis, c - dystrophic changes and fragmentation of cardiomyocytes.
Figure 2. Endocardial sclerosis detected in rats exposed to coronavirus infection.
Also, destructive-productive vasculitis was detected in 11 rats, and swelling of the endothelium with the development of endotheliitis was detected in 30 rats.
CD45 antigen was detected in 100.00% of cases. The average CD45+ lymphocyte count in coronavirus infection was 27.08±10.64 cells/mm2.
Figure 3. Immunohistochemical reactions for detection of CD45 in animals with coronavirus infection.
a- moderate number of CD45+ lymphocytes in the myocardial interstitium
b- a significant number of CD45+ lymphocytes in the myocardial interstitium
c- absence of CD45+ lymphocytes in the myocardial interstitium
CD3 antigen was detected in the infiltrate cells in 100% of cases (Figure 4). The average number of CD3+ T lymphocytes was 13.12±3.61 cells per 1 mm2.
Figure 4. CD3+ lymphocytes in rats with coronavirus infection.
a- moderate number of CD3+ T-lymphocytes in the myocardial interstitium
b- a significant number of CD3+ T- lymphocytes in the myocardial interstitium
c- absence of CD3+ T lymphocytes in the myocardial interstitium
CD68 + macrophages in the amount of up to 50% of infiltrate cells were detected in 17.64% of observations, CD20+ B-lymphocytes were not detected in any case. Perforin + NK-cells were determined in 4-5.88% of cases.
In 88.23% of cases, positive expression of lymphocytes and macrophages to the TLR type 4 marker was noted (Figure 5).
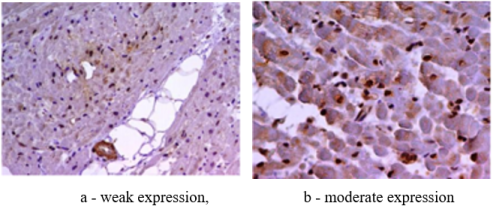
Figure 5. TLR type 4 in experimental animals with coronavirus infection.
In 91.17% of cases, positive expression of lymphocytes and macrophages to the TLR type 9 marker was observed (Figure 6). The average number of cells with positive expression was 54.50±32.46%.
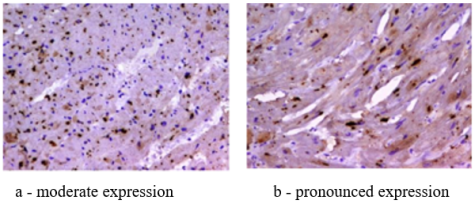
Figure 6. TLR type 9 in experimental animals with coronavirus infection.
Lymphocytic myocarditis was detected in all rats (100%). Dystrophic changes in cardiomyocytes were also detected in 57.4% of cases, apoptotic bodies in 29.41% of cases, uneven cardiomyocyte hypertrophy in 85.29% of cases, and lipofuscinosis in 45.59% of cases. Subendocardial lipomatosis in the cardiac conduction system was observed in 51.47% of cases. The average percentage of lipomatosis area from the micrograph area was 2.47±3.12%.
An extensive correlation analysis of quantitative and semi-quantitative data was conducted. The most significant correlation was found between the absolute counts of CD3+ T lymphocytes and TLR4+ cells (correlation coefficient r = 0.45), as well as CD3+ T lymphocytes and TLR9+ cells (correlation coefficient r = 0.38).
Positive expression of the SARS-CoV-2 spike protein was detected in myocardial inflammatory infiltrate cells, in the endothelium of coronary artery branches, and in cardiomyocytes. Pronounced expression in lymphocytes and macrophages of the myocardial inflammatory infiltrate was detected in 100% of cases. Furthermore, positive expression was detected in inflammatory infiltrate cells of the endocardium and pericardium, respectively. In the endothelium of small coronary artery branches, expression was detected in 84.37% of cases. Cardiomyocytes reacted positively with the marker in 22 cases (68.75%).
Figure 7. Expression of the SARS-CoV-2 spike protein.
a - pronounced expression in cardiomyocytes and myocardial infiltrate cells, b - expression in cardiomyocytes and vascular endothelial cells, c - positive control, block of cells
Positive expression of the SARS-CoV-2 nucleocapsid protein was detected in the myocardium in inflammatory infiltrate cells, vascular endothelium, and isolated cardiomyocytes. Lymphocytes and macrophages expressed the marker in 87.50% of cases. Positive protein expression was observed in the vascular endothelium of 78.12% of rats. Positive nucleocapsid protein expression was observed in cardiomyocytes in 65.62% of cases.
Figure 8. Expression of SARS-CoV-2 nucleocapsid protein.
As is known, natural autoantibodies used for diagnostic purposes to determine coronavirus infection are used in the ELIN test, which is another diagnostic marker of brain damage.
The determination of the profile of marker autoantibodies to neurospecific proteins and mediators is shown in Table 1.
Table 1. Study of the ELIN test for coronavirus infection.

Autoantibodies IgG

With brain damage

No brain damage

Intact

p

Mann-Winney U- test

IgG to NF 200

0.390 (0.283-0.653

0.296 (0.257-0.392)

0.202 (0.164-0.259)

< 0.05

0.7633212

IgG to glial fibrillary acidic protein

0.415 (0.305-0.450)

0.254 (0.231-0.450)

0.249 (0.209-0.363)

< 0.05

0.7112906

IgG to S 100 B

0.722 (0.494-1.096)

0.373 (0.241-1.096)

0.234 (0.184-0.303)

< 0.01

1,2165880

IgG to total myelin protein

0.237 (0.196-0.265)

0.162 (0.141-0.209)

0.153 (0.118-0.177)

< 0.01

1,3688104

IgG to voltage-dependent calcium channels

0.272 (0.222-0.344)

0.196 (0.157-0.329)

0.152 (0.119-0.196)

< 0.01

0.8741105

IgG to H-cholinergic receptors

0.390 (0.269-0.637)

0.234 (0.217-0.395)

0.176 (0.140-0.224)

< 0.01

0.8215549

IgG to glutamate receptors

0.308 (0.284-0.544)

0.259 (0.224-0.374)

0.189 (0.145-0.219)

< 0.01

0.9155491

IgG to GABA receptors

0.321 (0.284-0.621)

0.266 (0.232-0.373

0.192 (0.138-0.259)

< 0.01

0.7610028

IgG to dopamine receptors

0.303 (0.293-0.632)

0.295 (0.232-0.397)

0.186 (0.153-0.250)

< 0.01

0.9210083

IgG to serotonin receptors

0.380 (0.315-0.482)

0.349 (0.328-0.513)

0.244 (0.202-0.303)

< 0.01

0.8316382

IgG to opiate receptors

3.81±0.36

9.9±0.36

1.32±0.15

< 0.05

0

IgG to beta- endorphin

0.316 (0.296-0.344)

0.392 (0.367-0.421)

0.122 (0.103-0.145)

< 0.01

1,4399014

Note: Student-Fisher p-test
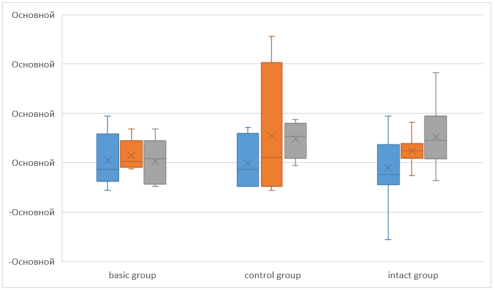
Figure 9. Application of multivariate ANOVA analysis in coronavirus infection with and without spinal cord injury.
Figure 9 shows the value of the multivariate ANOVA analysis, which, for different IgG values used in the ELIN test, corresponds to a value of 0.4532, which is a reliable indication, since it is known that values from 0.4126 to 0.4981 are absolute values indicating the severity of the inflammatory process in coronavirus infection.
Antibody levels to various receptors were determined using ELISA. The upper limit of antibody levels was defined as an increase in optical density by 2 standard deviations from the mean value in the control group.
Table 2 provides some statistical indicators characterizing the severity and intensity of the inflammatory process occurring in the spinal cord at the site of injury.
Table 2. Some statistical indicators obtained by the methodmultivariate analysis ANOVA.

Indicators

χ 2 (Pearson criterion)

U test (Mann-Whinney test)

H test (Kraskes-Wallis test)

W -test Shapiro- Wilk test

Main group

0.9185001

0.9008417

0.9341006

0.9120318

Control group

0.8210034

0.8521073

0.8438502

0.8230184

Indicators

χ 2 (Pearson criterion)

U test (Mann-Whinney test)

H test (Kraskes-Wallis test)

W -test Shapiro- Wilk test

Main group

0.9185001

0.9008417

0.9341006

0.9120318

Control group

0.8210034

0.8521073

0.8438502

0.8230184

Indicators

95% CI

OSH

Bonferroni correction

r (Spearman correlation analysis)

Weinberg equilibrium

Main group

3.0-6.3

0.9572104

0.9130047

0.9310082

0.9013862

Control group

2.4-7.9

0.8207383

0.8018369

0.7810284

0.8109375

Indicators

95% CI

OSH

Bonferroni correction

r (Spearman correlation analysis)

Weinberg equilibrium

Main group

3.0-6.3

0.9572104

0.9130047

0.9310082

0.9013862

Control group

2.4-7.9

0.8207383

0.8018369

0.7810284

0.8109375

IgG is involved in the inflammatory process, helping clear metabolic waste products from the body and regulating the function of various cell types. Increased levels of autoantibodies, which stimulate the production of lymphokines, play a role in the development of any pathological process. These lymphokines also enhance the T-cell response, which then triggers granzymes and perforins into the cell to neutralize and remove the phlogogenic agent.
Figure 9 shows the relationship between IgG and the severity of the inflammatory process. It is known that IgG circulates in the blood and, in the presence of an antigen, forms an antigen-antibody complex, which is neutralized by the complement system, the granzyme-perforin system, and antibody-dependent cell-mediated cytotoxicity itself.
Figure 10. The ratio of IgG to the severity of the inflammatory process in coronavirus infection with and without brain damage.
The prognostic value of the influence of the ELIN test on the course of coronavirus infection was assessed using ROC analysis.
Figure 11. ROC analysis of the possible influence of the ELIN test on the course of coronavirus infection.
The area under the curve (AUC) = 0.91 (95% CI = 0.85-0.98). The prediction accuracy of the prognostic model was 91.7%, sensitivity was 0.87%, and specificity was 0.95%. AUC was 0.91 (95% CI = 0.85-0.98), p < 0.001.
As is well known, ROC analysis is used to evaluate the prognostic value of various diagnostic indicators, and in particular, the ELIN test. Using ROC analysis, we determined the threshold values for the ELIN test, which allows us to predict the outcome of spinal cord injury.
An analysis of the ELIN test's ROC curve showed that it was reliable for spinal cord injury with and without spinal cord injury. The area under the curve (AUC) was excellent—0.91.
Meanwhile, in the group of animals with coronavirus infection, ROC analysis showed somewhat lower diagnostic efficacy. The weaker informativeness of the ROC curve in this group of animals was manifested by the curves' gentle slope above the diagonal (lower left corner, upper right corner), as well as smaller areas above them. The diagnostic value of the ROC curve was greatest in the group of animals with spinal cord injuries—the ROC curves were steepest, and the areas beneath them were largest. ROC analysis can be used as a rapid method, as its diagnostic efficacy varies from patient to patient and consistently increases with the severity of the pathological process.
Thus, according to the ROC analysis data in animals with coronavirus infection, a clear relationship was established between the ELIN test and the information content of the severity of the disease.
The Kaplan-Meier curve was used to evaluate animal survival data after coronavirus infection.
Figure 12. Kaplan-Meier curve in groups: 1-main group, 0-control group.
The vertical lines on the graph represent 95% confidence intervals.
According to the Kaplan-Meier curve, the survival probability for animals in the study group is 65%, while for animals in the control group it is 75%. The data obtained indicate that the risk of death after spinal injury in the study group remains quite high.
Moreover, in the γ-correlation model, the degree of dependence of an unfavorable outcome on the presence or absence of brain damage was not close (r = 0.20 at p = 0.32), but according to the Pearson criterion, this difference was not significant (p = 0.32, χ2 = 2.145).
As is known, high titers of autoantibodies IgGs reflect the activity and severity of the inflammatory process. Thus, elevated IgG levels to NF -200 in axons in severe cases of coronavirus infection (r = 0.528, p < 0.001). Table 3 shows the correlation between autoantibody titers. IgG to various antigens and receptors (ELIN test) in the dynamics of observation in animals with coronavirus infection.
Table 3. Correlation relationship of autoantibody titers IgG to various antigens and receptors (ELIN test) in the dynamics of observation in animals of the main group.

Autoantibodies IgG

In 3 days

In 7 days

In 14 days

p

Mann-Winney U- test

r (Spearman correlation)

IgG to NF 200

0.405 (0.383-0.653)

0.496 (0.457-0.592)

0.607 (0.564-0.659)

< 0.001

0.7633212

0.528

IgG to glial fibrillary acidic protein

0.515 (0.505-0.550)

0.554 (0.531-0.650)

0.649 (0.609-0.763)

< 0.001

0.7112906

0.388

IgG to S 100 B

0.822 (0.794-1.096)

0.873 (0.841-1.096)

0.934 (0.884-1.303)

< 0.001

1,2165880

0.623

IgG to total myelin protein

0.337 (0.296-0.365)

0.362 (0.341-0.409)

0.453 (0.418-0.477)

< 0.001

1,3688104

0.512

IgG to voltage-dependent calcium channels

0.372 (0.322-0.394)

0.396 (0.357-0.429)

0.452 (0.419-0.496)

< 0.001

0.8741105

0.475

IgG to H-cholinergic receptors

0.490 (0.469-0.637)

0.534 (0.517-0.595)

0.576 (0.540-0.624)

< 0.001

0.8215549

0.396

IgG to glutamate receptors

0.408 (0.384-0.544)

0.459 (0.424-0.474)

0.489 (0.445-0.519)

< 0.001

0.9155491

0.481

IgG to GABA receptors

0.421 (0.384-0.621)

0.466 (0.432-0.473

0.492 (0.438-0.559)

< 0.001

0.7610028

0.962

IgG to dopamine receptors

0.403 (0.393-0.632)

0.495 (0.432-0.597)

0.586 (0.553-0.650)

< 0.001

0.9210083

0.685

IgG to serotonin receptors

0.480 (0.415-0.582)

0.549 (0.528-0.613)

0.644 (0.602-0.703)

< 0.001

0.8316382

0.441

IgG to opiate receptors

4.81±0.36

10.9±0.36

11.32±0.15

< 0.05

0.0329715

0.293

IgG to beta- endorphin

0.416 (0.396-0.444)

0.492 (0.467-0.521)

0.522 (0.503-0.545)

< 0.001

1,4399014

0.851

We found that the ratio of IgG to opiate receptors was associated with the duration of the disease (r = 0.293, p < 0.05, H = 29.3).
Figure 13. Correlation matrix autoantibody titer IgG to various antigens and receptors (ELIN test) in the dynamics of observation in animals of the main group.
Table 4. Correlation relationship of autoantibody titers IgG to various antigens and receptors (ELIN test) in the dynamics of observation in animals of the control group.

Autoantibodies IgG

In 3 days

In 7 days

In 14 days

p

Mann-Winney U- test

r (Spearman correlation)

IgG to NF 200

0.505 (0.383-0.653)

0.596 (0.457-0.592)

0.707 (0.564-0.659)

< 0.001

0.7633212

0.561

IgG to glial fibrillary acidic protein

0.585 (0.505-0.550)

0.594 (0.531-0.650)

0.669 (0.609-0.763)

< 0.001

0.7112906

0.402

IgG to S 100 B

0.873 (0.794-1.096)

0.931 (0.841-1.096)

0.976 (0.884-1.303)

< 0.001

1,2165880

0.684

IgG to total myelin protein

0.437 (0.296-0.465)

0.462 (0.341-0.509)

0.553 (0.418-0.577)

< 0.001

1,3688104

0.720

IgG to voltage-dependent calcium channels

0.382 (0.322-0.394)

0.406 (0.357-0.429)

0.462 (0.419-0.496)

< 0.001

0.8741105

0.491

IgG to H-cholinergic receptors

0.500 (0.469-0.637)

0.544 (0.517-0.595)

0.586 (0.540-0.624)

< 0.001

0.8215549

0.496

IgG to glutamate receptors

0.418 (0.384-0.544)

0.469 (0.424-0.474)

0.499 (0.445-0.519)

< 0.001

0.9155491

0.902

IgG to GABA receptors

0.431 (0.384-0.621)

0.476 (0.432-0.473

0.502 (0.438-0.559)

< 0.001

0.7610028

0.332

IgG to dopamine receptors

0.413 (0.393-0.632)

0.505 (0.432-0.597)

0.586 (0.553-0.650)

< 0.001

0.9210083

0.704

IgG to serotonin receptors

0.490 (0.415-0.582)

0.559 (0.528-0.613)

0.654 (0.602-0.703)

< 0.001

0.8316382

0.671

IgG to opiate receptors

4.86±0.36

11.09±0.36

11.48±0.15

< 0.05

0.0329715

0.558

IgG to beta- endorphin

0.426 (0.396-0.444)

0.502 (0.467-0.521)

0.522 (0.503-0.545)

< 0.001

1,4399014

0.924

Figure 14. Correlation matrix autoantibody titer IgG to various antigens and receptors (ELIN test) in the dynamics of observation in animals of the control group.
Figure 15. Nonparametric indicators of the ELIN test for coronavirus infection based on the Kraskes-Wallis criterion with Bonferroni correction.
The model for the main group is statistically significant (Wald Chi-square p=0.002), consistent with the initial data (Hosmer-Lemeshow test p=0.470), has satisfactory information content (Nagelkirk criterion R2=55%), sufficient sensitivity (62%) and high specificity (95%).
The information content for IgG to serotonin receptors was: sensitivity - 78%; specificity - 67%; AUC = 0.763; criterion > 30.77 pg / ml at p = 0.0427 for the main group; sensitivity - 72%; specificity - 75%; AUC = 0.785; criterion > 29 pg / ml at p = 0.0022 for the control group.
Figure 16. One-way regression analysis of the influence of IgG to various antigens and receptors (ELIN test) in the dynamics of observation in animals of the main group.
The model for the control group is statistically significant (Wald Chi-square p=0.003), is in good agreement with the initial data (Hosmer-Lemeshow test p=0.515), has satisfactory information content (Nagelkirk criterion R2=40%), sufficient sensitivity (62.5%) and high specificity (87.5%).
Figure 17. One-way regression analysis of the influence of IgG to various antigens and receptors (ELIN test) in the dynamics of observation in animals of the control group.
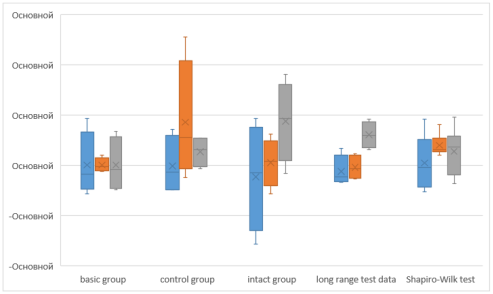
Figure 18. Determination of the influence of IgG to various antigens and receptors (ELIN test) in the dynamics of observation using the long-rank test.
Using long the rang test determined that the spinal cord injury model we proposed is statistically significant (Wald Chi-square p=0.003), is in good agreement with the initial data (Hosmer-Lemeshow test p=0.790), has satisfactory information content (Nagelkirk criterion R2=56%), sufficient sensitivity (63.2%) and high specificity (87.8%).
Figure 19. Correlation of one-way regression analysis and long - rang test on the experimental model of coronavirus infection and evaluation the influence of IgG to various antigens and receptors (ELIN test) in the dynamics of observation.
The advantage of these methods is that their application does not depend on the use of specific test systems, thereby expanding the capabilities of the methods.
The use of modern methods for determining correlation relationships allows for a highly accurate prediction of the outcome of coronavirus infection, regardless of the severity of inflammation.
boxplot or scat plot was constructed for survival analysis. Plot (Figure 20), in which dead rats are shown in blue and surviving rats in orange. Since the value of the quantitative indicator, chitotriosidase activity, had a non-normal distribution (p < 0.001 for normality testing using the Shapiro- Wilk test), we used the U- test. Mann-Whitney, p<0.001, indicating a statistically significant difference in chitotriosidase levels in the 4 groups.
It is clear that the average chitotriosidase activity for fatal cases is approximately 180 nmol /mL/h, and experimental animals reach the primary endpoint with chitotriosidase activity ranging from 150 to 200 nmol /mL/h. Recovery occurs more often with chitotriosidase activity of approximately 120 nmol /mL/h. According to our data, 6.4% of experimental animals had a chitotriosidase level of 0 nmol /mL/h; outcomes in these rats were not significantly better.
Figure 20. Survival analysis depending on the initial chitotriosidase activity.
To identify the association between independent variables (risk factors for an unfavorable prognosis) and the dependent binary variable—death from any cause during the study period—we performed logistic regression analysis. The prognostic value of the developed model was determined by constructing a receiver operating characteristic (ROC) curve. With a chitotriosidase cutoff threshold of 150 nmol /ml/h, the sensitivity was 55.9% and the specificity was 69.9% (Figure 21). It should be noted that the optimal cutoff threshold according to the Youden index is 100.5 nmol /ml/h (sensitivity 73.6%, specificity 55.1%), but since this value more closely corresponds to the average chitotriosidase activity of surviving rats, we decided to use a chitotriosidase activity of 150 nmol /ml/h for further analysis.
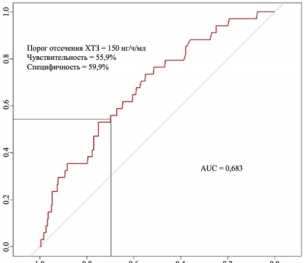
Figure 21. ROC curve characterizing the dependence of the probability of developing a fatal outcome in surviving rats with COVID-19 on the value of the logistic function P.
chitotriosidase activity > 150 nmol / ml / h and 7.2% had chitotriosidase activity < 150 nmol / ml / h (OR = 2.97; CI 1.44-6.12, p = 0.003). The odds ratio of 2.97 indicates that the odds of death in rats with chitotriosidase > 150 nmol / ml / h are almost 3 times higher than in rats with initial chitotriosidase activity less than 150 nmol / ml / h. The obtained results suggest that initial chitotriosidase activity > 150 nmol / ml / h significantly worsens the survival rate of experimental animals.
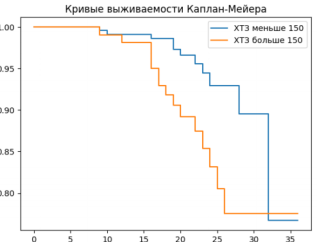
Figure 22. Kaplan -Meier curves showing the survival of rats with coronavirus infection with chitotriosidase activity above and below 150 nmol /ml/h.
To compare the prognostic significance of increased chitotriosidase activity with known laboratory biomarkers of adverse outcomes, quantitative parameters were assessed for compliance with normal distribution using the Shapiro- Wilk test (for samples with fewer than 50 rats) or the Kolmogorov-Smirnov test (for samples with more than 50 rats). Normally distributed quantitative parameters were described using mean values (M) and standard deviations (SD), and 95% confidence intervals (95% CI). In the absence of normal distribution, quantitative data were described using the median (Me) and lower and upper quartiles (Q1-Q3). Comparison of two groups for a normally distributed quantitative parameter, provided that variances were equal, was performed using the Student's t-test; in the case of unequal variances, it was performed using the Welch's t-test. Comparison of two groups for a quantitative indicator whose distribution differed from normal was performed using the Mann-Whitney U test.
To compare the prognostic significance of increased chitotriosidase activity with known laboratory biomarkers, a multivariate regression analysis was performed. This analysis included predictors of endpoint achievement identified in previous stages of the analysis, namely lymphocytes, platelets, NRL, PI, creatinine, C-reactive protein, and chitotriosidase. The results of the ROC analysis are presented in Table 5.
Table 5. Results of ROC analysis to determine threshold values for predictors of unfavorable course of COVID-19 (death from any cause).

Parameter

Cutoff

AUC

Lymphocytes, thousands/µL

0,89

0,660

Platelets х 10҆*9

253,5

0,538

NLR

4,26

0,784

PI, %

106,4

0,651

Creatinine, µmol/L

100,1

0,652

CRP, mg/L

83,7

0,718

Chitotriosidase nmol/mL/h

150

0,683

After determining the threshold values of potential laboratory predictors of unfavorable course of COV ID-19, odds ratios for each of them were calculated and then stepwise logistic regression was performed (Table 6).
Table 6. Stepwise logistic regression (death from any cause).

threshold values

Odds ratio

95% confidence interval

Lymphocytes, thousands/µL

3,64

1,739-7,756

Platelets х 10҆*9

3,317

1,373-7,533

NLR

2,667

0,794-8,954

PI, %

3,344

1,54-7,3

Creatinine, µmol/L

3,527

1,710-7,277

CRP, mg/L

2,973

1,077-8,208

Chitotriosidase nmol/mL/h

2,942

1,433-6,040

According to its results, independent laboratory predictors of death in surviving rats were the level of lymphocytes less than 0.89 thousand / μl, platelets more than 253.5 0.10 * 9 / l, prothrombin index less than 106.4%, creatinine more than 100.1 μmol / l, C-reactive protein more than 83.7 mg / l and chitotriosidase more than 150 nmol / ml / h at p < 0.05.
Point electrical stimulation with rectangular pulses of 0.2 ms duration was administered to the projection zones of the corresponding peripheral nerves (nn Peroneus dex et sin, nn Tibialis dex et sin, nn Femoralis dex et sin). The direct motor response of the muscle (M-response) was recorded in response to stimulation of the distal and proximal sections of the nerves, and the distance between stimulation points was measured to calculate the conduction velocity along the peripheral nerve in the "biceps femoris - gastrocnemius" region. The recorded motor responses were assessed based on the presence or absence of motor responses to stimulation. When recording the M-response, digital indices of amplitude, shape, and conduction velocity were assessed.
In order to assess the conductivity of the entire segmental arc, afferent and efferent conduction pathways, the H-reflex was recorded - a monosynaptic reflex response recorded from mm. biceps femoris for stimulation of the distal parts of the nn. Tibialis dex et sin. The latency of the recorded H-reflex, reflecting conductivity along the entire reflex arc, as well as the amplitude of the reflex response, were assessed.
When assessing sensorimotor deficits using the ENMG method, a lack of bioelectrical activity in the muscles under study and the H-reflex were detected in 9.1% of cases, indicating a complete block in the motor fibers of the corresponding peripheral nerves. Symmetrical absence of the M-response from the short extensor muscles was recorded in 57.7% of cases, and from the short flexor muscles - in 27.3% of cases. The M-response from the mm. extensor carpi ulnaris was not obtained in 17.9% of cases.
Table 7. Indicators of sensorimotor activity according to stimulation ENMG data in experimental animals with coronavirus infection.

Parameters

M±SD

95% CI

r

χ 2

Amplitude of the M-response of m. Biceps femoris., mV

1.22±0.56

0.99-1.47

<0.05

12,357

M-response amplitude m. triceps brachii., mV

1.35±0.44

1.01-1.95

< 0.05

10.98

The amplitude of the M-response of the peroneus muscle longus, mV

0.61±0.22

0.33-1.02

< 0.05

9,847

Amplitude of the M-response of the gastrocnemius muscle, mV

0.65±0.27

0.35-1.04

< 0.05

9,851

Amplitude of the M-response of m. extensor carpi ulnaris , mV

0.44±0.15

0.23-0.56

< 0.05

8.74

Amplitude of the M-response of m. tibialis cranialis, mV

0.47±0.16

0.21-0.63

< 0.05

8.63

Note: CI - confidence interval, χ 2 - Pearson’s test
When receiving an M-response with mm.. Biceps femoris and triceps brachii (42.3% and 38.5% of observations, respectively), mm. peroneus Electroneurophysiological signs of axonal polyneuropathy of the lower extremities were detected in the femoral nerves (71.4% and 65.5% of cases, respectively). These included changes in the shape of motor responses, decreased amplitude values, and a lack of amplitude increase with increasing stimulation. The most intact parameters were observed in the study of motor conduction functions along the femoral nerve fibers. The recorded motor responses had normal shape parameters, without lateral differences. This is likely due to the fact that the femoral nerves are not considered long nerves, like the peroneal and tibial nerves.
The average values of the amplitude of the M-response of all the studied muscles, as well as the H-reflex in the main group, were reduced by more than 2 times, which reflects both disturbances in the conduction function of long motor conductors (M-response) and pathological changes in the afferent part of the arc of the monosynaptic reflex of the spinal cord (H-reflex).
Table 8. ENMG indices in rats of the intact group.

Parameters

M±SD

95% CI

r

χ 2

Amplitude of the M-response of m. Biceps femoris., mV

1.92±0.56

1.22-2.31

<0.05

10,347

M-response amplitude m. triceps brachii., mV

1.85±0.44

1.01-2.15

< 0.05

9,154

The amplitude of the M-response of the peroneus muscle longus, mV

0.92±0.22

0.63-1.22

< 0.05

9,774

Amplitude of the M-response of the gastrocnemius muscle, mV

0.65±0.27

0.35-1.04

< 0.05

8,332

Amplitude of the M-response of m. extensor carpi ulnaris, mV

0.84±0.15

0.23-0.96

< 0.05

7,891

Amplitude of the M-response of m. tibialis cranialis., mV

0.97±0.16

0.21-0.63

< 0.05

12,033

Note: CI - confidence interval, χ 2 - Pearson’s test
The set of complementary ENMG techniques used in examining experimental animals included the recording and analysis of M-responses. The shape of the stimulating impulses was rectangular, the duration was 1 ms, the intensity was supramaximal; the stimulating electrode type was fork-shaped (S403); the points of nerve stimulation during the recording of M-responses of the foot muscles were distal; the method of recording was unipolar (bellytendon); the analyzed parameter was the amplitude from peak to peak. Maximum H-reflexes of m. gastrocnemius were recorded (the shape and duration of the stimulating stimuli, the method of recording and the analyzed parameters were the same as for M-responses). Global electromyograms were analyzed: the functional test was “maximum voluntary tension”; the test objects were m. Biceps femoris, m. gastrocnemius (cl.), m. peroneus longus, m. tibialis cranialis; lead type: bipolar; electrode diameter: 3 mm, interelectrode distance: 5 mm; analyzed parameters: average amplitude (AA) and signal repetition rate.
It has been established that the main quantitative characteristic (amplitude) of the total evoked potential of the tested muscle (M-response), used in this work as an integral assessment of the post-traumatic preservation of motor neuron pools, before and at various times after surgery, depends to a certain extent on the level of spinal injury.
During this difficult diagnostic period, experimental animals with coronavirus infection exhibited a decreased amplitude of motor responses (M-responses), which is typically characteristic of this type of injury. This initial manifestation was due to the absence of diffuse demyelination during this period, which occurred later. Damage to the myelin sheath manifested itself primarily in the development of conduction blocks, manifested by the loss of F-waves. The decreased amplitude of motor responses was not associated with true axonal damage (i.e., axon death), but was due to impaired excitability of motor neuron processes. This was manifested in a decrease in axonal excitability (9.2 ± 1.2 mV) to a short-duration pulse current (0.1 ms) and its preservation (13.7 ± 2.9 mV) to a long-duration current (0.5 ms) in animals of the main group in 92.3%, which is characteristic of irreversible damage to peripheral motor neurons.
The severity of motor impairments in coronavirus infection during the acute phase of symptom development correlates with a decrease in F-wave detection (r=0.89) and a decrease in axonal excitability to short-duration current (r=0.81). Thus, neural excitability indices were used to enhance the diagnostic value of stimulation EMG, providing stimulation EMG with 98% informational value and methodological accessibility.
Damage to the anterior horns of the spinal cord during the acute period of coronavirus infection (up to 7 days) was not accompanied by typical anterior horn changes on needle EMG, as occurs in the later period (14 days).
In this regard, the most diagnostic information was provided by stimulation EMG with features of decreased axonal excitability to short-duration current (4.8 ± 0.7 mV - 7.2 ± 1.2 mV) in combination with a drop in the proximal-distal neural conductivity coefficient to 95.8 ± 2.5 - 92.0 ± 2.2, and an increase in the amplitude of the H-reflex (r = 0.77). Changes in the functional properties of peripheral motor neuron processes (part of peripheral nerves) with damage to their cell bodies (anterior horns) can be explained by partial damage to the cell body, which predominantly affects the cell regions furthest from the cell body—the axon terminals and distal segments—due to disruption of axonal (trophic) transport, the so-called axonal degeneration (dying-back process). Analysis of ENMG parameters over time allowed us to clarify the specific features of motor neuron damage in spinal cord injury with spinal cord damage: the presence of ENMG signs of involvement of the anterior horns of the spinal cord, combined with damage to the pyramidal tracts and mild demyelination of the roots, allowed us to interpret the disturbances in these types of injuries as subclinical manifestations of myelopolyradiculopathy.
This type of spinal injury was characterized by decreased excitability of the distal peripheral nerves. Low excitability of the nerve trunks was expressed by a decrease in the interpeak amplitude of the distal M-response to currents of both short (0.1 ms) and long duration (0.5 ms), ranging from 1.5 to 13 mV (7.9 ± 0.9) with an average normal value of 29.3 ± 4.6 mV. Functional impairments of segmental excitability were observed, manifested by an increase or decrease in the H-reflex. Rapid reversal of ENMG parameters suggests mechanisms of impairment other than true demyelination.
In rats treated with Ganoderma Lucidum and Alkhadaya, the development of coronavirus infection was characterized by a favorable course and rapid, full recovery of function. The localization and nature of traumatic spinal injury without spinal cord damage, characterized by predominant damage to the motor neuron cell body and individual nerve fibers in rats, allow the traumatic factor to be used in these cases as a criterion for the probable localization of the lesion and disease prognosis. The difficulty in diagnosing coronavirus infection during the acute period of the disease (up to 3 days) was due to the absence of changes in the SPI in sensory and motor fibers (50.6 ± 4.7 m/s - 56.0 ± 5.4 m/s), which is generally expected to decrease in demyelinating spinal cord lesions. A decrease in the amplitude of motor responses (M-response) was observed, which is usually characteristic of axonal lesions. This feature of the initial manifestations of demyelinating lesions was due to the absence of diffuse demyelination during this period, which occurred later, and damage to the myelin sheath manifested itself primarily in the development of conduction blocks in the form of F-wave loss. The decrease in the amplitude of motor responses was not associated with true axonal damage (i.e., axon death), but was due to a violation of the excitability of the processes of motor neurons. This was manifested in a decrease in axonal excitability (9.2 ± 1.2 mV) to a short-duration pulse current (0.1 ms) and its preservation (13.7 ± 2.9 mV) to a long-duration current (0.5 ms) in rats, which is characteristic of reversible damage to peripheral motor neurons.
The severity of motor impairments in spinal injuries without spinal cord injury during the acute phase of symptom development correlates with decreased F-wave detection (r=0.89) and decreased axonal excitability to short-duration current (r=0.81), while during the recovery period, it correlates with decreased axonal excitability to short- and long-duration current (r=0.78). Thus, neural excitability indices were used to enhance the diagnostic value of stimulation EMG, providing stimulation EMG with 98% informational value and methodological accessibility.
Damage to the anterior horns of the spinal cord during the acute period of coronavirus infection (up to 7 days) was not accompanied by typical anterior horn changes on needle EMG, as occurs in the later period (14 days).
In this regard, the most diagnostic information was provided by stimulation EMG with features of decreased axonal excitability to short-duration current (4.8 ± 0.7 mV - 7.2 ± 1.2 mV) in combination with a drop in the proximal-distal neural conductivity coefficient to 95.8 ± 2.5 - 92.0 ± 2.2. With this type of lesion, the severity of motor disorders correlated with a decrease in axonal excitability to long-duration current (r = 0.77), and in the acute period (up to 7 days) - to short-duration current (r = 0.69) and an increase in the amplitude of the H-reflex (r = 0.77). Analysis of ENMG parameters during the course of the disease allowed us to clarify the characteristics of motor neuron damage in acute traumatic spinal injury without spinal cord injury: the presence of ENMG signs of involvement of the anterior horns of the spinal cord in combination with damage to the pyramidal tracts and mild demyelination of the roots, which allowed us to interpret the disturbances as subclinical manifestations of coronavirus infection.
Three types of impairments have been identified in coronavirus infection: decreased neural conductivity (type I, 33%), decreased peripheral nerve excitability (type II, 40%), and changes in segmental spinal cord excitability (type III, 27%). In type I, the motor nerve conductivity (MRC) in the distal tibial nerve segments decreased to 42 ± 3.8 m/s, with a mean normal value of 54.8 ± 4.1 m/s (P < 0.05). The distal M-response duration increased to 8-11 ms (upper normal limit 8 ms).
The residual latency of the M-response exceeded the upper limit of the norm by 1.5-2 times, amounting to 3.1-6.1 ms.
The second type was characterized by decreased excitability of the distal parts of the peripheral nerves. Low excitability of the nerve trunks was expressed in a decrease in the interpeak amplitude of the distal M-response to current of both short (0.1 ms) and long duration (0.5 ms), ranging from 1.5 to 13 mV (7.9 ± 0.9) with an average normal value of 29.3 ± 4.6 mV. The third type was distinguished by functional disorders of segmental excitability in the form of an increase or decrease in the H-reflex. Rapid reverse dynamics of ENMG parameters indicates mechanisms of disorders different from true demyelination. The nature of changes in ENMG parameters in spinal trauma without damage to the spinal cord allows us to consider it a variant of a mild abortive course of traumatic disease.
Table 9. Indicators of sensorimotor activity according to stimulation ENMG data in experimental animals with coronavirus infection against the background of the use of Ganoderma Lucidum and Alkhadaya.

Parameters

M±SD

95% CI

r

χ 2

Amplitude of the M-response of m. Biceps femoris., mV

1.67±0.56

1.20-2.02

<0.05

16,441

M-response amplitude m. triceps brachii., mV

1.78±0.44

1.34-1.95

< 0.05

13.15

The amplitude of the M-response of the peroneus muscle longus, mV

0.93±0.22

0.63-1.12

< 0.05

8,334

Amplitude of the M-response of the gastrocnemius muscle, mV

0.95±0.27

0.75-1.23

< 0.05

9,771

Amplitude of the M-response of m. extensor carpi ulnaris., mV

0.87±0.15

0.63-0.96

< 0.05

3.57

Amplitude of the M-response of m. tibialis cranialis., mV

0.91±0.16

0.81-1.13

< 0.05

9.52

Note: CI - confidence interval, χ 2 - Pearson’s test
On the first day of illness, EMG diagnostics allowed differentiation of nerve damage from centrally caused spinal trauma without spinal cord injury by assessing the amplitude and latency of the early and late responses of the grasp reflex. The latency of the responses increased, and the amplitude decreased until it disappeared, which characterized the residual number of functioning nerve fibers. The severity of the block in the period from 3 to 14 days of illness development indicated the degree of nerve fiber involvement in the pathological process, but could not answer the question and the nature of the lesion (axonal or demyelinating). From the 7th day of illness, a decrease in the amplitude of the M-response of the n. Tibialis muscles during direct stimulation of the nerve, it reflected the degree of severity of the axonal nature of the lesion caused by the death of the axial cylinder of the axon, and amounted to 0.6 ± 0.1 mV with a relatively favorable course of the disease.
Restoration of the grasp reflex amplitude by day 14 of illness was a favorable prognostic indicator of nerve function recovery, as was rapid subsequent recovery of muscle function within 1-2 weeks. In cases of prolonged loss of the grasp reflex (more than 10 days), the amplitude of the muscle M-response was a prognostic indicator of recovery. n. tibialis: if the amplitude value is less than 50% of the unaffected side, recovery is unfavorable, more than 50% - relatively favorable.
An EMG study was conducted to objectively assess damage to the motor and sensory fibers of the cerebral cortex. The following parameters were assessed: excitation propagation velocity (EPV), distal latency (DL), motor response amplitude (M-response), and conduction blocks.
In some experimental animals, a decrease in NCV was observed in motor fibers, which is associated with axonal demyelination. In most rats with spinal cord injuries without spinal cord damage, NCV parameters did not differ from normal values when the recording methodology was followed. It is worth noting that 15 rats in the control group showed a decrease in motor response amplitude, despite normal NCV values.
Electrophysiological signs of axonal injury were confirmed by recording spontaneous activity using needle myography, as well as by the reorganization of motor units toward increased amplitude and duration (reinnervation). The presence of spontaneous activity indicates muscle fiber denervation and can also occur in motor neuron disease, making it difficult to differentiate purely motor forms of injury. Demyelinating signs, as determined by stimulation EMG, are characterized by persistent changes with increasing disease duration. However, not all cases of proven traumatic disease were able to obtain electrophysiological confirmation of the disease entity.
Thus, only in half of the cases of experimental animals with spinal injuries without spinal cord damage did the results of the EMG study comply with the international criteria for traumatic disease; in the remaining cases, either non-compliance with the criteria or a complete absence of it was noted.
This suggests that stimulation EMG has limited sensitivity to demyelinating forms of spinal cord injury without spinal cord injury. For axonal forms, spontaneous activity recorded using needle EMG at the corresponding time point after disease onset was 100% sensitive and was observed in all studies. However, the results of single-shot stimulation myography in experimental animals with axonal forms of spinal cord injury without spinal cord injury were significantly less sensitive (43% in the control group). Dynamic studies were able to record a decrease in the amplitude of the evoked motor response in a series of studies spaced 1-2 weeks apart.
In rats with damaged nerve trunk, the study revealed motor, sensory, and autonomic-trophic disorders. Autonomic-trophic disorders (mainly with damage to the median nerve) in the form of pallor or cyanosis of the skin in the distal parts of the extremities were determined in 6 rats, and dryness and trophic disorders of the skin in the innervation zone of the damaged nerve were observed in 10 rats. At the time of the study, all rats had paresis of the muscles innervated by the damaged nerve, of varying severity. In 15 (25%) rats, a decrease in muscle strength to 4 points was observed, in 16 (26.6%) - to 3 points, in 9 (15%) rats - to 2 points, and in 20 (33.3%) rats, severe motor disorders were observed - up to 0-1 point. Hypotrophy (due to muscle fiber degeneration) was detected in 30% of cases (18 rats). When using provocative tests in rats, the Tinel test proved to be the most informative, detected in 44 (73.3%) rats. A positive paw compression test was detected in 38 (63.3%) rats, and a positive elevation test was detected in 18 (30%) rats.
When assessing the degree of nerve damage using the functional neurological impairment scale (Dyck PJ), the highest total score was found in rats with neuropathy of the peroneal nerve (13+2.9 points), the lowest total score was noted in rats with neuropathy of the ulnar nerve (4.7+0.7 points).
Table 10. Dynamics of changes in ENMG studies in rats of the main group.

ENMG parameter

Indicators (after 14 days)

Amplitude of the M-response of the Biceps muscle femoris (n.medianus)

2.5±1.9

DL n.medianus

4.8±3.1

SRV n. medianus

23.2±9.0

Amplitude of the M-response with m. gastrocnemius (n.tibialis)

1.4±0.1

DL n.tibialis

6.5±3.2

CRV n.tibialis

20.7±6.9

No M-response with m. gastrocnemius (n.tibialis)

38.8% (n=7)

Absence of PD n.suralis

100% (n=18)

Analyzing the parameters of the ENMG study dynamics in rats with coronavirus infection, we found that the earliest indicator of nerve compression was a decrease in local impulse conduction velocity along sensory fibers at the level of compression. Conduction velocity along sensory fibers damaged as a result of compression was almost two times lower than normal (24.9 ± 4.7 m/s with an average norm of 50 m/s) and varied depending on the severity of the lesion from 21.5 m/s to 44.2 m/s. Nerve compression resulted in a decrease in the amplitude of the sensory response, on average, to 5.4 ± 2.4 mV (average norm is 7 mV). In later stages of the development of compression neuropathies, a decrease in local conduction velocity along motor fibers was detected, indicating more severe damage to the peripheral nerve. On average, the impulse conduction velocity (ICV) along motor fibers in our observations decreased to 34.5 ± 2.7 m/s (61.3% of the normal IPV value along motor fibers). Measuring IPV along sensory fibers was a more sensitive and, therefore, more informative test compared to measuring IPV along motor fibers of the same nerve. Furthermore, in rats, damage to the nerve trunk resulted in a decrease in the amplitude of the motor response to an average of 1.64 ± 0.6 mV (the average norm is 6 mV). Moreover, the amplitude of the M-response correlated with the H -reflex.
Severe damage was diagnosed in 15 (25%) rats, moderate damage in 27 (45%) rats; mild damage was present in 18 (30%) rats. Electromyography in rats with nerve trunk damage revealed a significant decrease in the electrogenesis of the corresponding muscle groups, in the form of a decrease in the amplitude of biopotentials compared to normal values by almost two times (on average by 569 μV), the appearance of arrhythmic fasciculation potentials. In 13 (5%) rats of the main group, Bioelectrical silence; in 3 cases (5%), type 4 EMG was recorded in rats of the control group. Analyzing the parameters of the EMG study in rats with spinal cord injury, the earliest indicator of nerve compression was a decrease in local conduction velocity along sensory fibers at the level of compression. Conduction velocity along sensory fibers damaged by compression was almost half the normal value (24.9 ± 4.7).
Thus, in all rats with axonal forms, the absence of an evoked motor response was recorded upon stimulation of the nerves of the fore and hind paws, while in rats of the control group, only 38.8% had no motor response from n. tibialis.
Stimulation EMG confirmed the previously identified axonal sensory and motor neuropathy of the forepaw nerves; there were no motor responses from the foot and lower leg muscles. Needle-electrode EMG of the forepaw and hindpaw muscles revealed an ongoing denervation-reinnervation process with a restructuring of motor unit potentials according to the neuritic type, with moderate spontaneous muscle fiber activity; neuromyotonic discharges were observed in the distal and proximal forepaw muscles.
Activation of collateral pathways was characteristic of the majority of rats in the main group and was manifested in a sharp accentuation of the psilateral response, not observed in rats in the control group.
Thus, the analysis of the parameters of the ipsilateral response allows us to interpret the fact of its registration as a criterion for an unfavorable prognosis for compensation of motor disorders.
ENMG is characterized by a decreased M-response, a decrease in the rate of excitation propagation along efferent fibers, an increase in the latency period, and a decrease in the amplitude of the M- and H-responses. Peripheral circulatory examination revealed capillary spasm, decreased blood filling, and venous congestion. The rats' forepaws are "marbled" and pale, the dorsal surface of the paws is moist, cold, and edematous, and there is difficulty flexing all joints of the forepaws.
As is known, a pathological increase in the H-reflex amplitude is associated with an increase in the activity of motor neurons in the anterior horns of the spinal cord due, as a rule, to a decrease in the inhibitory regulatory influences from the suprasegmental structures. The h-amplitude values in the groups on day 3 were comparable (p = 0.3415; Welch's criterion): 3.25 ± 0.65 in the main group and 3.12 ± 0.54 in the control group. On the paretic side, the values were statistically significantly higher: 3.73 ± 0.57 in the main group (p = 0.0001; Student's t-test for dependent samples) and 3.58 ± 0.44 (p = 0.0008), which clearly demonstrates a weakening of descending inhibitory influences on the paretic side compared to the contralateral in both groups.
When assessed dynamically (after 14 days), the h-amplitude value in the main group showed a statistically significant increase (p < 0.0001; Student's t-test for dependent samples) and amounted to 4.04 ± 0.70, while in the control group the increase was insignificant, up to 3.85 ± 0.48 (p = 0.1003).
The median current value for the onset of the H-reflex on the contralateral side among experimental animals was 9.5 (7.0; 14.0) mA and was statistically significantly higher on the paretic side: 13.0 (11.0; 14.0) mA, respectively. On the 7th day of the experiment, a tendency toward an increase in current values was noted on the paretic side in the main group, while no significant changes were observed in the control group.
The initial values of the current strength for the M-response on the contralateral side were comparable between the groups (p = 0.6927; Mann-Whitney test): the median was 18.0 (16.0; 19.0) mA in the main group and 17.0 (15.0; 28.5) mA in the control group. On the paretic side, no statistically significant differences were noted between the groups either (p = 0.0825): 21.0 (18.0; 23.0) mA in the main group and 26.0 (16.0; 29.0) mA in the control group. When re-evaluated after 14 days, the current strength values in the main group were statistically significantly higher (p < 0.0001; Wilcoxon test), while in the control group there was a slight decrease to a level of 23.0 (15.5; 29.0) mA.
4. Conclusions
Use of a new combination drug based on Ganoderma Lucidum and Alkhadaya expand treatment options for coronavirus infection and open new horizons in clinical medicine, as the use of this pharmaceutical composition does not cause side effects, and recovery occurs naturally.
Abbreviations

EMG

Electromyography

n.

Nerves

Author Contributions
Abilov Pulat Mеlisovich is the sole author. The author read and approved the final manuscript.
Conflicts of Interest
The author declares that there is no conflicts of interest.
References
[1] Abilov PM, Makhkamova FT (2018) Clinical and functional evaluation of the effectiveness of treatment of chronic catarrhal gingivitis in children with the use of biologically active additives based on Ganoderma Lutsidum. Pediatrics, Scientific and Practical Journal, Tashkent 1: 108-111.
[2] Abilov PM Efficienty of individual prophylaxis of Dental Caries using dental gel Ispring based on Ganoderma Lucidum in schoolchildren in Tashkent. Journal of Dentistry and Oral Health. 2018; 5: 1 -4.
[3] Abilov PM, Iriskulov BU, Saydalikhodjaeva OZ, Seytkarimova GS, Norboeva SA, Musaev Kh. A. An experimental assessment of the influence of Ganoderma lucidum on the state of oxidative stress. International journal of scientific & technology research 2020; 9(3): 6645-6649.
[4] Abdullah, F., Myers, J., Basu, D., Tintinger, G., Ueckermann, V., Mathebula, M., et al. (2022). Decreased severity of disease during the first global omicron variant covid-19 outbreak in a large hospital in tshwane, South Africa. Int. J. Infect. Dis. 116, 38-42.
[5] Abu- Raddad, L. J., Chemaitelly, H., and Butt, A. A. National Study Group for COVID-19 Vaccination (2021). Effectiveness of the BNT162b2 Covid-19 vaccine against the B. 1.1.7 and B. 1.351 variants. N. Engl. J. Med. 385, 187-189.
[6] Ackermann, M., Verleden, SE, Kuehnel, M., Haverich, A., Welte, T., Laenger, F., et al. (2020). Pulmonary vascular Endothelialitis, thrombosis, and angiogenesis in Covid-19. N. Engl. J. Med. 383, 120-128.
[7] Afkhami, S., D'Agostino, M. R., Zhang, A., Stacey, H. D., Marzok, A., Kang, A., et al. (2022). Respiratory mucosal delivery of next-generation COVID-19 vaccine provides robust protection against both ancestral and variant strains of SARS-CoV-2. Cell 185, 896-915.
[8] Alonso- Canovas, A., Kurtis, M. M., Gomez- Mayordomo, V., Macías-García, D., Gutiérrez Viedma, A., Mondragón Rezola, E., et al. (2023). Functional neurological disorders after COVID-19 and SARS-CoV-2 vaccines: a national multicentre observational study. J. Neurol. Neurosurg. Psychiatry 94, 776-777.
[9] Alu, A., Chen, L., Lei, H., Wei, Y., Tian, X., and Wei, X. (2022). Intranasal COVID-19 vaccines: from bench to bed. EBioMedicine 76: 103841.
[10] Andreano, E., Piccini, G., Licastro, D., Casalino, L., Johnson, N. V., Paciello, I., et al. (2021). SARS-CoV-2 escape from a highly neutralizing COVID-19 convalescent plasma. Proc. Natl. Acad. Sci. USA 118: 54118.
[11] Ao, D., He, X., Liu, J., and Xu, L. (2023). Strategies for the development and approval of COVID-19 vaccines and therapeutics in the post-pandemic period. Signal Transduct. Target. Ther. 8: 466.
[12] Arvin, A. M., Fink, K., Schmid, M. A., Cathcart, A., Spreafico, R., Havenar-Daughton, C., et al. (2020). A perspective on potential antibody-dependent enhancement of SARS-CoV-2. Nature 584, 353-363.
[13] Baum, A., Fulton, B. O., Wloga, E., Copin, R., Pascal, K. E., Russo, V., et al. (2020). Antibody cocktail to SARS-CoV-2 spike protein prevents rapid mutational escape seen with individual antibodies. Science 369, 1014-1018.
[14] Berardicurti, O., Ruscitti, P., Ursini, F., D'Andrea, S., Ciaffi, J., Meliconi, R., et al. (2020). Mortality in tocilizumab -treated patients with COVID-19: a systematic review and meta-analysis. Clin. Exp. Rheumatol. 38, 1247-1254.
[15] Blanco- Melo, D., Nilsson- Payant, B. E., Liu, W. C., Uhl, S., Hoagland, D., Møller, R., et al. (2020). Imbalanced host response to SARS-CoV-2 drives development of COVID-19. Cell 181, 1036-1045.
[16] Boehm, E., Kronig, I., Neher, R. A., Eckerle, I., Vetter, P., Kaiser, L., et al. (2021). Novel SARS-CoV-2 variants: the pandemics within the pandemic. Clin. Microbiol. Infect. 27, 1109-1117.
[17] Borczuk, A. C. (2021). Pulmonary pathology of COVID-19: a review of autopsy studies. Curr. Opin. Pulm. Med. 27, 184-192.
[18] Bourgonje, AR, Abdulle, AE, Timens, W., Hillebrands, JL, Navis, GJ, Gordijn, S. J., et al. (2020). Angiotensin-converting enzyme 2 (ACE2), SARS-CoV-2 and the pathophysiology of coronavirus disease 2019 (COVID-19). J. Pathol. 251, 228-248.
[19] Bournazos, S., Gupta, A., and Ravetch, J. V. (2020). The role of IgG fc receptors in antibody-dependent enhancement. Nat. Rev. Immunol. 20, 633-643.
[20] Bricker, T. L., Darling, T. L., Hassan, A. O., Harastani, H. H., Soung, A., Jiang, X., et al. (2020). A single intranasal or intramuscular immunization with chimpanzee adenovirus vectored SARS-CoV-2 vaccine protects against pneumonia in Hamsters. bioRxiv [Preprint].
[21] Bukhari K, Mulley G, Gulyaeva AA, et al. Description and initial characterization of metatranscriptomic nidovirus -like genomes from the proposed new family abyssoviridae, and from a sister group to the coronavirinae, the proposed genus alphaletovirus. Virology. 2018; 524: 160-171.
[22] Butowt, R., Bilinska, K., and Von Bartheld, C. S. (2020). Chemosensory dysfunction in COVID-19: integration of genetic and epidemiological data points to D614G spike protein variant as a contributing factor. ACS Chem. Neurosci. 11, 3180-3184.
[23] Cameroni, E., Bowen, J. E., Rosen, L. E., Saliba, C., Zepeda, S. K., Culap, K., et al. (2022). Broadly neutralizing overcome antibodies SARS-CoV-2 omicron antigenic shift. Nature 602, 664-670.
[24] Campos, K. R., Sacchi, C. T., Abbud, A., and Caterino -de-Araujo, A. (2021). SARSCoV-2 variants in severely symptomatic and deceased persons who had been vaccinated against COVID-19 in São Paulo, Brazil. Rev. Panam. Salud Publica 45: e 126.
[25] Cao, Z., Gao, W., Bao, H., Feng, H., Mei, S., Chen, P., et al. (2023). VV116 versus Nirmatrelvir -ritonavir for Oral treatment of Covid-19. N. Engl. J. Med. 388, 406-417.
[26] Carvajal JJ, Garc´ıa -Castillo V, Cuellar SV, Campillay-Ve´liz CP, Salazar -Ardiles C, Avellaneda AM, Muñoz CA, Retamal-D´ıaz A, Bueno S. M, Gonza´lez PA, Kalergis AM and Lay MK (2024) New insights into the pathogenesis of SARS-CoV- 2 during and after the COVID-19 pandemic. Front. Immunol. 15: 1363572.
[27] Chemaitelly, H., Yassine, H. M., Benslimane, F. M., al Khatib, H. A., Tang, P., Hasan, M. R., et al. (2021). mRNA-1273 COVID-19 vaccine effectiveness against the B. 1.1.7 and B. 1.351 variants and severe COVID-19 disease in Qatar. Nat. Med. 27, 1614-1621.
[28] Chen, J., Wang, P., Yuan, L., Zhang, L., Zhang, L., Zhao, H., et al. (2022). A live attenuated virus-based intranasal COVID-19 vaccine provides rapid, prolonged, and broad protection against SARS-CoV-2. Sci. Bull. 67, 1372-1387.
[29] Choudhary, O. P., Priyanka, M. T. A., Mohammed, T. A., and Singh, I. (2021). Intranasal COVID-19 vaccines: is it a boon or bane? Int. J. Surg. 94: 106119.
[30] Chu, H., Chan, J. F., Wang, Y., Yuen, T. T., Chai, Y., Hou, Y., et al. (2020). Comparative replication and immune activation profiles of SARS-CoV-2 and SARS- CoV in human lungs: an ex vivo study with implications for the pathogenesis of COVID-19. Clin. Infect. Dis. 71, 1400-1409.
[31] Colson, P., Bader, W., Fantini, J., Dudouet, P., Levasseur, A., Pontarotti, P., et al. (2023). From viral democratic genomes to viral wild bunch of quasispecies. J. Med. Virol. 95: e 29209.
[32] Costa, R., Olea, B., Bracho, M. A., Albert, E., de Michelena, P., Martínez -Costa, C., et al. (2022). RNA viral loads of SARS-CoV-2 alpha and Delta variants in nasopharyngeal specimens at diagnosis stratified by age, clinical presentation and vaccination status. J. Infect. 84, 579-613.
[33] Davies, N. G., Abbott, S., Barnard, R. C., Jarvis, C. I., Kucharski, A. J., Munday, J. D., et al. (2021). Estimated transmissibility and impact of SARS-CoV-2 lineage B. 1.1.7 in England. Science 372: 3055.
[34] de Melo, G. D., Lazarini, F., Levallois, S., Hautefort, C., Michel, V., Larrous, F., et al. (2021). COVID-19-related anosmia is associated with viral persistence and inflammation in human olfactory epithelium and brain infection in Hamsters. Sci. Transl. Med. 13: 8396.
[35] de Wit, E., van Doremalen, N., Falzarano, D., and Munster, V. J. (2016). SARS and MERS: recent insights into emerging coronaviruses. Nat. Rev. Microbiol. 14, 523-534.
[36] Dejnirattisai, W., Huo, J., Zhou, D., Zahradník, J., Supasa, P., Liu, C., et al. (2022). SARS-CoV-2 omicron -B. 1.1.529 leads to widespread escape from neutralizing antibody responses. Cell 185, 467-484.
[37] Delgado, S., Somovilla, P., Ferrer -Orta, C., Martínez -González, B., Vázquez- Monteagudo, S., Muñoz-Flores, J., et al. (2024). Incipient functional SARSCoV-2 diversification identified through neural network haplotype maps. Proc. Natl. Acad. Sci. USA 121: e 2317851121.
[38] Domizio, J. D., Gulen, M. F., Saidoune, F., Thacker, V. V., Yatim, A., Sharma, K., et al. (2022). The cGAS -STING pathway drives type I IFN immunopathology in COVID-19. Nature 603, 145-151.
[39] Du, L., He, Y., Zhou, Y., Liu, S., Zheng, B. J., and Jiang, S. (2009). The spike protein of SARS-CoV-2 is a target for vaccine and therapeutic development. Nat. Rev. Microbiol. 7, 226-236.
[40] Ellul, M. A., Benjamin, L., Singh, B., Lant, S., Michael, B. D., Easton, A., et al. (2020). Neurological associations of COVID-19. Lancet Neurol. 19, 767-783.
[41] Fan, Y., Li, X., Zhang, L., Wan, S., Zhang, L., and Zhou, F. (2022). SARS-CoV-2 omicron variant: recent progress and future perspectives. Signal Transduct. Target. Ther. 7: 141.
[42] Faria, NR, Mellan, TA, Whittaker, C., Claro, IM, Candido, DDS, Mishra, S., et al. (2021). Genomics and epidemiology of the P. 1 SARS-CoV -2 lineage in Manaus, Brazil. Science 372, 815-821.
[43] Fernández-Castañeda, A., Lu, P., Geraghty, A. C., Song, E., Lee, M. H., Wood, J., et al. (2022). Mild respiratory COVID can cause multi-lineage neural cell and myelin dysregulation. Cell 185, 2452-2468.
[44] Fiolet, T., Kherabi, Y., MacDonald, C. J., Ghosn, J., and Peiffer-Smadja, N. (2022). Comparing COVID-19 vaccines for their characteristics, efficacy and effectiveness against SARS-CoV-2 and variants of concern: a narrative review. Clin. Microbiol. Infect. 28, 202-221.
[45] Fisman, D. N., and Tuite, A. R. (2021). Evaluation of the relative virulence of novel SARS-CoV-2 variants: a retrospective cohort study in Ontario, Canada. J Assoc Med Can 193, E1619-E1625.
[46] Forchette, L., Sebastian, W., and Liu, T. (2021). A comprehensive review of COVID-19 virology, vaccines, variants, and therapeutics. Curr Med Sci. 41, 1037-1051.
[47] Gao, Y. D., Ding, M., Dong, X., Zhang, J. J., Kursat Azkur, A., Azkur, D., et al. (2021). Risk factors for severe and critically ill COVID-19 patients: a review. Allergy 76, 428-455.
[48] Garcia-Beltran, W. F., Lam, E. C., St. Denis, K., Nitido, A. D., Garcia, Z. H., Hauser, B. M., et al. (2021). Multiple SARS-CoV-2 variants escape neutralization by vaccine-induced humoral immunity. Cell 184, 2372-2383.
[49] Georg, P., Astaburuaga-García, R., Bonaguro, L., Brumhard, S., Michalick, L., Lippert, L. J., et al. (2022). Complement activation induces excessive T cell cytotoxicity in severe COVID-19. Cell 185, 493-512.
[50] GeurtsvanKessel, CH, Geers, D., Schmitz, KS, Mykytyn, AZ, Lamers, MM, Bogers, S., et al. (2022). Divergent SARS-CoV-2 omicron-reactive T and B cell responses in COVID-19 vaccine recipients. Sci Immunol. 7: 2202.
[51] Greaney, AJ, Loes, AN, Crawford, KHD, Starr, TN, Malone, KD, Chu, HY, et al. (2021). Comprehensive mapping of mutations in the SARS-CoV-2 receptorbinding domain that affect recognition by polyclonal human plasma antibodies. Cell Host Microbe 29, 463-476.
[52] Greene, C., Connolly, R., Brennan, D., Laffan, A., O'Keeffe, E., Zaporojan, L., et al. (2024). Blood-brain barrier disruption and sustained systemic inflammation in individuals with long COVID-associated cognitive impairment. Nat. Neurosci. 27, 421-432.
[53] Gruell, H., Vanshylla, K., Tober -Lau, P., Hillus, D., Schommers, P., Lehmann, C., et al. (2022). mRNA booster immunization elicits potent neutrali zing serum activity against the SARS-CoV-2 omicron variant. Nat. Med. 28, 477-480.
[54] Gupta, A., Madhavan, M. V., Sehgal, K., Nair, N., Mahajan, S., Sehrawat, T. S., et al. (2020). Extrapulmonary manifestations of COVID-19. Nat. Med. 26, 1017-1032.
[55] Hadj, H. I. (2022). Covid-19 vaccines and variants of concern: a review. Rev. Med. Virol. 32: e 2313.
[56] Hadj Hassine, I., Ben M'hadheb, M., and Menéndez-Arias, L. (2022). Lethal mutagenesis of RNA viruses and approved drugs wit h antiviral mutagenic activity. Viruses 14: 841.
[57] Hadjadj, J., Yatim, N., Barnabei, L., Corneau, A., Boussier, J., Smith, N., et al. (2020). Impaired type I interferon activity and inflammatory responses in severe COVID-19 patients. Science 369, 718-724.
[58] Harvey, W. T., Carabelli, A. M., Jackson, B., Gupta, R. K., Thomson, E. C. Harrison, E. M., et al. (2021). SARS-CoV-2 variants, spike mutations and immune escape. Nat. Rev. Microbiol. 19, 409-424.
[59] Hashimoto, T., Perlot, T., Rehman, A., Trichereau, J., Ishiguro, H., Paolino, M., et al. (2012). ACE2 links amino acid malnutrition to microbial ecology and intestinal inflammation. Nature 487, 477-481.
[60] Hassan, AO, Kafai, NM, Dmitriev, IP, Fox, JM, Smith, BK, Harvey, IB, et al. (2020). A single-dose intranasal ChAd vaccine protects upper and lower respiratory tracts against SARS-CoV-2. Cell 183, 169-184.
[61] Heurich, A., Hofmann-Winkler, H., Gierer, S., Liepold, T., Jahn, O., and Pöhlmann, S. (2014). TMPRSS2 and ADAM17 cleave ACE2 differentially and only proteolysis by TMPRSS2 augments entry driven by the severe acute respiratory syndrome coronavirus spike protein. J. Virol. 88, 1293-1307.
[62] Ho, C. Y., Salimian, M., Hegert, J., O'Brien, J., Choi, S. G., Ames, H., et al. (2022). Postmortem assessment of olfactory tissue degeneration and microvasculopathy in patients with COVID-19. JAMA Neurol. 79, 544-553.
[63] Hoffmann, M., Kleine -Weber, H., Schroeder, S., Krüger, N., Herrler, T., Erichsen, S., et al. (2020). SARS-CoV-2 cell entry depends on ACE2 and TMPRSS2 and is blocked by a clinically proven protease inhibitor. Cell 181, 271-280.
[64] Holter, J. C., Pischke, S. E., de Boer, E., Lind, A., Jenum, S., Holten, A. R., et al. (2020). Systemic complement activation is associated with respiratory failure in COVID-19 hospitalized patients. Proc. Natl. Acad. Sci. USA 117, 25018-25025.
[65] Huang, C., Wang, Y., Li, X., Ren, L., Zhao, J., Hu, Y., et al. (2020). Clinical features of patients infected with 2019 novel coronavirus in Wuhan. Lancet 395, 497-506.
[66] Hue, S., Beldi-Ferchiou, A., Bendib, I., Surenaud, M., Fourati, S., Frapard, T., et al. (2020). Uncontrolled innate and impaired adaptive immune responses in patients with COVID-19 acute respiratory distress syndrome. Am. J. Respira. Crit. Care Med. 202, 1509-1519.
[67] Hui, KPY, Ho, JCW, Cheung, MC, Ng, KC, Ching, RHH, Lai, KL, et al. (2022). SARS-CoV-2 omicron variant replication in human bronchus and lung ex vivo. Nature 603, 715-720.
[68] Jingshu Zhang, Melanie Rissmann, Thijs Kuiken, and Bart L. Haagmans Comparative Pathogenesis of Severe Acute Respiratory Syndrome Coronaviruses. Annu. Rev. Pathol. Mech. Dis. 2024. 19: 423-51.
[69] Li X, Mi Z, Liu Z and Rong P (2024) SARS-CoV-2: pathogenesis, therapeutics, variants, and vaccines. Front. Microbiol. 15: 1334152.
[70] Natalie M. Kirk, Yuying Liang & Hinh Ly (2024) Pathogenesis and virulence of coronavirus disease: Comparative pathology of animal models for COVID-19, Virulence, 15: 1, 2316438,
[71] Zhang, X., Wu, S., Wu, B., Yang, Q., Chen, A., Li, Y., et al. (2021). SARS-CoV-2 omicron strain exhibits potent capabilities for immune evasion and viral entrance. Signal Transduct. Target. Ther. 6: 430.
Cite This Article
  • APA Style

    Mеlisovich, A. P. (2026). A Comprehensive Assessment of Post-COVID-19 Changes and Its Correction with the Help of G. Lucidum and Alkhaday. American Journal of Medical Science and Technology, 2(2), 32-56. https://doi.org/10.11648/j.ajmst.20260202.13

    Copy | Download

    ACS Style

    Mеlisovich, A. P. A Comprehensive Assessment of Post-COVID-19 Changes and Its Correction with the Help of G. Lucidum and Alkhaday. Am. J. Med. Sci. Technol. 2026, 2(2), 32-56. doi: 10.11648/j.ajmst.20260202.13

    Copy | Download

    AMA Style

    Mеlisovich AP. A Comprehensive Assessment of Post-COVID-19 Changes and Its Correction with the Help of G. Lucidum and Alkhaday. Am J Med Sci Technol. 2026;2(2):32-56. doi: 10.11648/j.ajmst.20260202.13

    Copy | Download

  • @article{10.11648/j.ajmst.20260202.13,
      author = {Abilov Pulat Mеlisovich},
      title = {A Comprehensive Assessment of Post-COVID-19 Changes and Its Correction with the Help of G. Lucidum and Alkhaday},
      journal = {American Journal of Medical Science and Technology},
      volume = {2},
      number = {2},
      pages = {32-56},
      doi = {10.11648/j.ajmst.20260202.13},
      url = {https://doi.org/10.11648/j.ajmst.20260202.13},
      eprint = {https://article.sciencepublishinggroup.com/pdf/10.11648.j.ajmst.20260202.13},
      abstract = {In December 2019, a series of acute respiratory illnesses characterized by rapid worsening of symptoms, pneumonia, acute respiratory distress syndrome (ARDS), and in some cases, death were observed in Wuhan City, Hubei Province, China. To achieve the set objective, the results of treatment of 100 sexually mature rats of both sexes with coronavirus infection caused by COVID -19 were analyzed. All animals were divided into groups: Group 1 - animals with coronavirus infection with a confirmed positive PCR test, treated with ivermectin at a dosage of 300 mg of body weight (n = 25), Group 2 - animals with coronavirus infection treated with baicalin at a dosage of 500 mg (n = 25), Group 3 - animals with coronavirus infection treated with molnupiravir 25 mg / kg of body weight (n = 25), Group 4 - animals with coronavirus infection treated with a new drug based on G. lucidum and black cumin (n = 25). Lymphocytic myocarditis was detected in all rats (100%). Dystrophic changes in cardiomyocytes were also detected in 57.4% of cases, apoptotic bodies in 29.41% of cases, uneven cardiomyocyte hypertrophy in 85.29% of cases, and lipofuscinosis in 45.59% of cases. Subendocardial lipomatosis in the cardiac conduction system was observed in 51.47% of cases. The average percentage of lipomatosis area from the micrograph area was 2.47±3.12%. The area under the curve (AUC) = 0.91 (95% CI = 0.85-0.98). The prediction accuracy of the prognostic model was 91.7%, sensitivity was 0.87%, and specificity was 0.95%. AUC was 0.91 (95% CI = 0.85-0.98), p < 0.001.},
     year = {2026}
    }
    

    Copy | Download

  • TY  - JOUR
    T1  - A Comprehensive Assessment of Post-COVID-19 Changes and Its Correction with the Help of G. Lucidum and Alkhaday
    AU  - Abilov Pulat Mеlisovich
    Y1  - 2026/03/10
    PY  - 2026
    N1  - https://doi.org/10.11648/j.ajmst.20260202.13
    DO  - 10.11648/j.ajmst.20260202.13
    T2  - American Journal of Medical Science and Technology
    JF  - American Journal of Medical Science and Technology
    JO  - American Journal of Medical Science and Technology
    SP  - 32
    EP  - 56
    PB  - Science Publishing Group
    UR  - https://doi.org/10.11648/j.ajmst.20260202.13
    AB  - In December 2019, a series of acute respiratory illnesses characterized by rapid worsening of symptoms, pneumonia, acute respiratory distress syndrome (ARDS), and in some cases, death were observed in Wuhan City, Hubei Province, China. To achieve the set objective, the results of treatment of 100 sexually mature rats of both sexes with coronavirus infection caused by COVID -19 were analyzed. All animals were divided into groups: Group 1 - animals with coronavirus infection with a confirmed positive PCR test, treated with ivermectin at a dosage of 300 mg of body weight (n = 25), Group 2 - animals with coronavirus infection treated with baicalin at a dosage of 500 mg (n = 25), Group 3 - animals with coronavirus infection treated with molnupiravir 25 mg / kg of body weight (n = 25), Group 4 - animals with coronavirus infection treated with a new drug based on G. lucidum and black cumin (n = 25). Lymphocytic myocarditis was detected in all rats (100%). Dystrophic changes in cardiomyocytes were also detected in 57.4% of cases, apoptotic bodies in 29.41% of cases, uneven cardiomyocyte hypertrophy in 85.29% of cases, and lipofuscinosis in 45.59% of cases. Subendocardial lipomatosis in the cardiac conduction system was observed in 51.47% of cases. The average percentage of lipomatosis area from the micrograph area was 2.47±3.12%. The area under the curve (AUC) = 0.91 (95% CI = 0.85-0.98). The prediction accuracy of the prognostic model was 91.7%, sensitivity was 0.87%, and specificity was 0.95%. AUC was 0.91 (95% CI = 0.85-0.98), p < 0.001.
    VL  - 2
    IS  - 2
    ER  - 

    Copy | Download

Author Information